Admin - Numberble

Which Number Is Rational? Apex Learning Answer

which number is rational apex

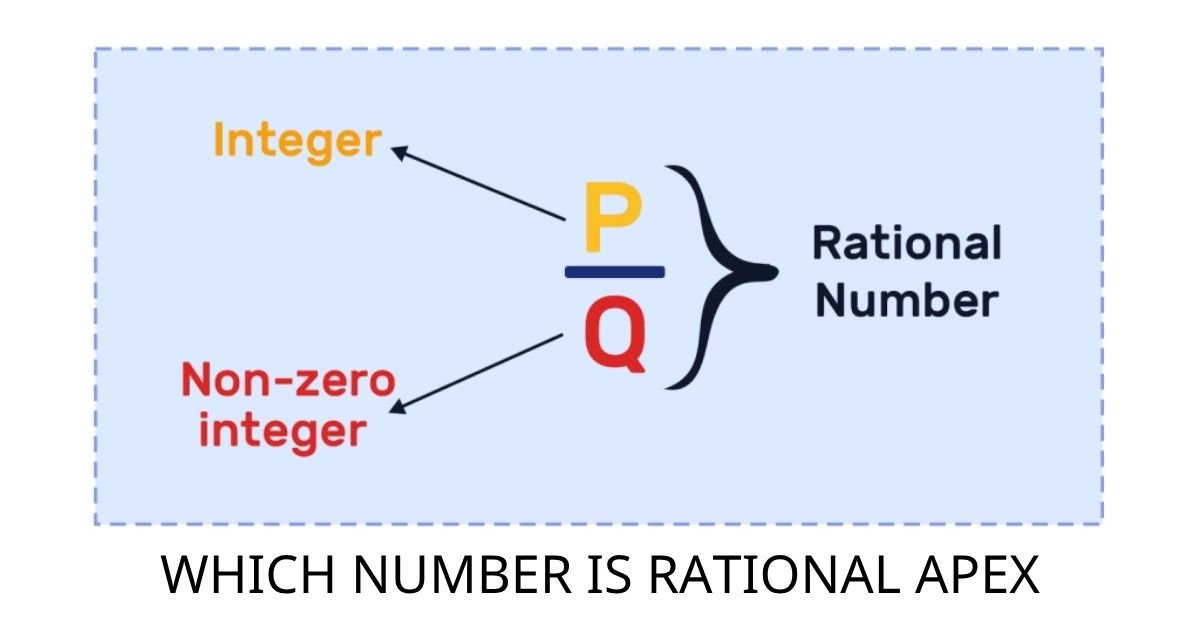
Students working through Apex Learning’s Algebra 1 unit on rational and irrational numbers often hit one specific quiz question that trips them up: “Which number is rational?” This article gives you the direct answer to the “which number is rational apex” question and, more importantly, explains the reasoning clearly enough that you can answer any version of it confidently. The quizzes typically presents four options, including things like 0.333…, pi, square roots, and integers, and asks you to pick the rational one. By the end of this page, you will know exactly why one of those options qualifies and the others do not. Quick Answer From the typical Apex Learning quiz options, 0.333… (or 1/3) is the rational number. A number is rational if it can be written as a fraction of two integers. Repeating decimals like 0.333… always can be. Numbers like pi, square root of 2, or any non-repeating infinite decimal cannot, so they are irrational. What Makes a Number Rational? Think of the word “rational” as having the word “ratio” buried inside it. A rational number is simply any number that can be expressed as a ratio of two whole numbers, written as p/q, where p and q are both integers and q is not zero. That one rule covers a much wider range of numbers than most students initially expect. Whole numbers are rational because any whole number can be placed over 1. The number 5 becomes 5/1, the number 12 becomes 12/1, and even negative integers work the same way. Fractions with integer numerators and denominators are obviously rational too, since they are already written in the required form. The less obvious category is decimals, and that is exactly where the Apex Learning quiz tests you. Decimals split into two groups. A decimal that terminates, meaning it ends at some point, is always rational. The number 0.75 equals 3/4, and 0.6 equals 3/5, both clean fractions. A decimal that goes on forever can still be rational if it repeats in a pattern. The number 0.333… is just another way of writing 1/3, and 0.090909… equals 1/11. Repeating patterns always signal that the number can be converted to a fraction. The Four Types of Numbers in the Apex Quiz The Apex Learning quiz on rational and irrational numbers typically includes four answer options designed to test whether you can apply the definition rather than just memorize it. Recognizing each type quickly is the key skill the quiz is measuring. 0.333… (or 0.3 with a bar over it) is the rational number in most versions of this question. The repeating decimal 0.333… equals exactly 1/3, which is a fraction of two integers. That satisfies the definition completely, and this is the answer you should select. Pi (approximately 3.14159…) is irrational. Its decimal form never ends and never settles into a repeating pattern. Mathematicians have calculated pi to trillions of digits and found no repeating cycle anywhere. No fraction of two integers can produce pi exactly, which is why we keep it as the symbol rather than writing it as a number. The square root of 2 (approximately 1.41421…) is also irrational. It was actually the first number ever proven to be irrational, discovered by ancient Greek mathematicians. Like pi, its decimal never terminates and never repeats. If you see any square root of a number that is not a perfect square in the quiz options, it is irrational. Integers like 5 or -3 are rational, since they equal 5/1 or -3/1. If an integer appears as an answer option alongside 0.333…, both are rational, but quiz versions usually include only one rational option among three irrational ones. How to Spot a Rational Number in Any Quiz The three-step method works for every version of this question, whether it appears on Apex, a state exam, or a classroom test. First, check if the number is an integer or a plain fraction with integers on top and bottom. If yes, it is rational, and you are done. Second, if the number is a decimal, check whether it terminates. A decimal that ends at any point is rational without exception. Third, if the decimal goes on indefinitely, look for a repeating pattern. A bar over one or more digits in the written form tells you those digits repeat. If a pattern exists, the number is rational. If the digits appear random and never settle into a cycle, like pi or the square root of 7, the number is irrational. Running through those three steps takes about ten seconds once you have practiced them a couple of times. For deeper practice with numbers involving square roots and radicals, Numberble’s Radical Calculator lets you evaluate radical expressions quickly, which helps when checking whether a square root simplifies to a whole number (rational) or stays in irrational form. What Most People Get Wrong About Rational Numbers The most common mistake on this exact Apex quiz question is assuming that any decimal must be irrational. Students see a number like 0.333… going on forever and immediately think “it never ends, so it must be irrational.” That logic feels reasonable but is wrong, and the quiz is specifically designed to catch this misunderstanding. The correct rule is not about whether the decimal ends, but whether it follows a predictable pattern. A decimal that repeats, no matter how long the repeating block is, can always be converted into a fraction. The number 0.142857142857… repeating, for example, equals exactly 1/7. The length of the repeating cycle does not matter at all. What disqualifies a decimal from being rational is when the digits are genuinely random with no repeating block, which is what happens with pi and non-perfect-square roots. Understanding this distinction also protects you from a second error: dismissing something like 0.666… as irrational because it looks “messy.” The value 0.666… equals 2/3 exactly, making it rational without any doubt. According to Math Is Fun’s guide on irrational numbers, a reliable way to remember this is … Read more

What Number Is Missing from the Table? How to Find It

what number is missing from the table

Finding what number is missing from the table is one of the most practical math skills you will use, from grade school worksheets to real-world data analysis. Whether the table uses addition, multiplication, a relative frequency chart, or a pattern-based sequence, there is always a logical rule connecting every cell. Once you know how to spot that rule, the blank almost fills itself in. This article walks you through the most common table types, the step-by-step method for solving each one, and the mistakes that trip people up most often. By the end, you will be able to look at any number table with a missing value and find the answer with confidence. Quick Answer To find the missing number in a table, first identify the rule connecting the existing numbers — whether that is addition, multiplication, a consistent pattern across rows or columns, or a formula like relative frequency. Apply that same rule to the row or column containing the blank. Verify your answer by checking it against at least one other row. How to Find the Missing Number in a Table The first thing to do when you see a blank in a number table is resist the urge to guess. Most people scan the numbers quickly and pick something that “looks right,” but that approach fails on any table more complex than simple counting. Instead, look at the rows and columns separately before combining your findings. Take a basic multiplication table where the top row reads 2, 4, 6, 8 and the left column reads 2, 4, 6, 8. Each cell holds the product of the row header and the column header. If the cell at row 6, column 4 is blank, the answer is simply 6 × 4 = 24. The rule here is clear and consistent because every single cell follows it. Real table puzzles work the same way, even when the rule is less obvious at first glance. For addition tables, the method is identical. Suppose you have a table where the first row sums read 3, 5, 7, 9 and the second row reads 5, 7, 9, 11. Each cell in the table equals the sum of its row number and column number. A blank cell in row 4 and column 6 would be 4 + 6 = 10. Once you confirm the pattern holds across at least two full rows, you can trust it to apply to the missing value as well. Finding Missing Numbers in Frequency and Data Tables Statistical tables work differently from arithmetic tables, and they trip up a large number of students at every level. A relative frequency table, for example, lists categories alongside the proportion of total occurrences each one represents. If a teacher records grade results for 25 students and Grade A has a frequency of 6 and a relative frequency of 0.24, you can confirm the total: 6 ÷ 0.24 = 25 students in total. Now suppose Grade B has a frequency of 7 but the relative frequency cell is blank. You divide 7 by 25 to get 0.28. That is the missing number. The key step most people miss is finding the total first, because without the total, the relative frequency formula has no anchor. The formula is simple: relative frequency equals the category’s individual count divided by the overall total count. The same logic applies to any proportional or percentage table. If you know that four out of five cells in a row must total 100%, and the existing values sum to 72%, the missing value is 28%. Always check whether the rule is additive (rows or columns sum to a fixed number) or multiplicative (cells equal a product of headers) before calculating, since applying the wrong formula gives the wrong answer every time. Pattern-Based Tables: Reading Rows and Columns Together Some tables do not use standard arithmetic operations at all. Instead, each cell’s value comes from combining the row value and the column value through a less obvious rule. These appear frequently in math puzzles, brain teasers, and competitive exams. The approach is to look at a cell where you know all three values — the row header, the column header, and the cell itself — and work out the relationship. Imagine a table where row 3 and column 4 give the cell value 12, row 5 and column 4 give 20, and row 2 and column 6 gives 12. Here the rule is: row header × column header = cell value. Finding a blank in row 7 and column 3 gives 21. You can use the percentage calculator at Numberble to quickly verify proportional relationships when your table involves percentages or ratios, saving time on the mental arithmetic. More complex patterns involve differences between consecutive cells. In a puzzle where the values down a column read 3, 11, 12 and the rule is that each cell equals the sum of the two values above it, minus 2, you can work through the steps systematically. Recognizing this kind of second-order rule takes practice, but the method is always the same: find three complete data points, deduce the rule, then apply it once more to find the blank. Step-by-Step Method for Any Missing Number Table Solving any missing-number table becomes manageable with a clear sequence of steps. Start by looking for the row or column that is most complete, meaning the one with the fewest unknowns. Identify the operation or rule that connects all the known values in that row or column. Confirm your suspected rule against a second complete row or column. Then apply the rule to the incomplete row or column to find the missing value, and finally check the result against whichever row or column intersects the blank cell from a different direction. For instance, if you work out the missing value by analyzing the column and it gives you 42, check whether 42 also fits the row pattern. If both directions agree, you have the right answer. If … Read more

What Is the Number Game? Types, Rules, and History

what is the number game

The number game is one of those terms that can mean completely different things depending on who you ask. A math teacher will describe it as a logic puzzle that sharpens reasoning skills. A historian might point to a century-old underground lottery. Someone on their phone at lunch is probably talking about a brain training app. This article covers all three meanings clearly, starting with the most common one people search for today. By the end, you will know exactly what the number game is, how each version works, and which misconception trips up almost everyone who hears the phrase. Quick Answer The number game refers to any game or puzzle built around guessing, matching, or solving numbers using logic and arithmetic. The term also has a historical meaning as an illegal lottery popular in 20th-century America. Today, it most commonly describes brain puzzles, logic challenges, and number-guessing games played for fun and mental exercise. What Is the Number Game? Think of a game where someone says, “I am thinking of a number between 1 and 100, and you have six chances to guess it.” Each wrong guess earns a clue: too high, too low, or close. That simple back-and-forth is the most recognizable form of the number game, and it captures the essential idea perfectly. The goal is to use logic, elimination, and reasoning to land on the correct answer before you run out of attempts. No board, no cards, no setup required beyond two people and their minds. The broader definition stretches well past that one example. Number games, as defined in mathematical terms, include any of various puzzles and games that involve aspects of mathematics, ranging from naive amusements to sophisticated problems those mathematicians have never fully solved. That covers everything from a simple “guess my number” game played with a child to complex logic puzzles involving algebraic reasoning. The common thread across all of them is that numbers are not just the subject matter; they are the mechanism through which the game is played. What makes number games compelling is the way they balance accessibility with depth. You do not need to be good at math to enjoy a basic number-guessing game. But as the complexity increases, the same core structure can challenge people who work with mathematics professionally. That range of difficulty within a single concept is part of why the number game has remained popular across generations and formats. The Classic Guess-My-Number Format The most traditional version of the number game works like this: one player picks a secret number within an agreed range, and the other player guesses. After each incorrect guess, the picker says whether the actual number is higher or lower. The guesser narrows the range with each attempt until they reach the answer. It looks simple, and for young players it is purely fun, but experienced players quickly discover that there is a mathematically optimal strategy hiding inside this game. That strategy is called binary search, and it cuts the pool of possibilities in half with every question. If someone thinks of a number between 1 and 1,000, the guesser needs just 10 questions using this method, because each response cuts the remaining possibilities in half, and cutting 1,000 in half 10 times leaves only a single possibility. Most people who have played the guessing game casually have stumbled into this method without knowing its name, instinctively starting near the middle of the range. The fact that a game children play in elementary school maps directly onto a computer science algorithm used in searching sorted databases is a good example of how the number game sits at the intersection of recreation and genuine mathematical thinking. Modern digital versions of this format have evolved into Wordle-style number puzzles, where players guess an equation or a multi-digit number and receive color-coded feedback. If you enjoy that kind of number guessing challenge, the Numberle game on Numberble lets you guess hidden numbers with structured hints, following the same satisfying elimination logic. Number Games as Brain Puzzles and Math Recreations Beyond the guessing format, the number game category covers a wide range of puzzle types that challenge players to find hidden patterns, match digit pairs, or reach target sums using a limited set of numbers. These mathematical recreations have a universal appeal, with the urge to solve a puzzle appearing equally in young and old, in unsophisticated and sophisticated players alike. That is an important point because it explains why number games show up in kindergarten classrooms, competitive puzzle tournaments, and smartphone app stores all at the same time One popular format involves a grid of digits where players must eliminate all numbers by pairing identical values or pairs that add up to 10. Another format, popularized by the television show “Letters and Numbers,” gives players six randomly selected numbers and a three-digit target, requiring them to reach that target using only addition, subtraction, multiplication, and division. In that version, each of the six numbers may be used once, and the goal is to arrive at the target number, or as close as possible, using the four basic arithmetic operations. These games reward flexible thinking because there is rarely one single route to the answer. For a thorough grounding in why number puzzles have fascinated people for centuries, the Britannica article on number games traces their history from ancient Greece through modern recreational mathematics, showing how the same puzzle instinct has driven both casual players and serious researchers. The Historical Meaning: The Numbers Game as an Illegal Lottery Anyone researching this phrase will also encounter an older, very different meaning. The numbers game was the most widespread lottery game in the United States before lottery games were legalized in many states, though it was illegal wherever it was played, and its players were drawn chiefly from low-income communities. The way it worked was simple: a player picked any three-digit number from 000 to 999 and placed a small bet, usually less than one … Read more

How to Play Nerdle: Rules, Tips & Strategy

how to play nerdle

Nerdle is a daily math puzzle that challenges you to find a hidden equation in six tries, using color-coded feedback after every guess. This guide covers everything you need to know about how to play Nerdle, from the basic rules to the strategies that separate beginners from consistent solvers. Whether you fired it up for the first time today or you’ve been playing for a week and feel stuck, this article will give you a clear picture of the mechanics, the logic behind smart guessing, and the specific mistakes that trip up most new players. Quick Answer Nerdle is a free daily math puzzle where you guess an 8-character equation in 6 tries. Each guess must be a valid math equation. After each attempt, tiles turn green (right position), purple (wrong position), or black (not in the equation). Use those color clues to narrow down the answer. What Is Nerdle and Where Did It Come From Nerdle is a free, browser-based math puzzle created by Richard Mann and his daughter Imogen in early 2022. The idea came out of a car ride conversation about the Wordle craze, when they realized there was no equivalent for math fans. Within minutes they had settled on the rules and the name, and the game quickly spread to players in over 53 countries within its first week. The original version presents you with an 8-character equation, using digits 0 through 9 and the operators plus, minus, multiply, divide, and equals. There are currently 17,723 chosen solutions, selected from over 100,000 mathematically valid possibilities by the Nerdle team. The game resets daily at midnight GMT, meaning everyone around the world solves the same puzzle on the same day. A new challenge appears at 4 PM PST, 7 PM EST, or 1 AM Central European Time, depending on your location. You can also switch on a local time reset in the settings so the puzzle refreshes at midnight in your own time zone instead. The Core Rules Explained Every guess you enter must be a mathematically correct equation. That means the left side must actually equal the number on the right side of the equals sign, otherwise you’ll see a message that says “That guess doesn’t compute” and it won’t count as a try. The equals sign must always be present, and there can only be a plain number on the right side of it, never another calculation. Standard order of operations applies throughout the game. Multiplication and division are calculated before addition and subtraction, so an equation like 1+2*4=9 is valid because you multiply 2 by 4 first to get 8, then add 1. Many players find this catches them off guard, especially if they haven’t thought about PEMDAS or BODMAS since school. The good news is that the game provides a clear error message if your math is wrong, so you never accidentally waste a guess on an equation that doesn’t work. Commutative answers are accepted by default. If the target equation is 10+20=30 and you type 20+10=30, the game recognizes them as equivalent and accepts it as correct. This rule only applies when every other part of your equation matches the solution exactly. You can switch off commutative acceptance in the settings if you want the stricter version of the challenge. A Step-by-Step Beginner’s Guide to Playing Nerdle Open your browser and go to nerdlegame.com. You’ll see a grid of 6 rows and 8 columns, along with an on-screen keyboard showing digits and operators. If you’re on a laptop, you can also type using your physical keyboard, which most experienced players prefer for speed. Your first guess should be a valid equation that uses as many different digits and operators as possible. A strong opening guess like 12+35=47 immediately reveals information about six different digits. After you hit enter, each tile flips to show a color: green means the character is correct and in the right position, purple means it exists in the equation but sits in the wrong spot, and black means it doesn’t appear in the solution at all. Use those colors to build your second guess. If a tile turned green, keep that character in the exact same position. If it turned purple, you know the character is needed somewhere else in the equation, so move it to a different spot while keeping the equation valid. Black tiles tell you to stop using that character entirely. By the third and fourth guess, you should be significantly narrowing down the possibilities. Most players who use clues systematically can crack the puzzle in four tries or fewer. Nerdle Game Variants Worth Knowing The classic 8-tile version is the flagship puzzle, but Nerdle also offers several variants for different moods and skill levels. Mini Nerdle uses only 6 characters, which makes it shorter and slightly more accessible while still requiring real logical thinking. Speed Nerdle starts you with a partial guess and counts down a clock, adding pressure to your decision-making in a way that feels entirely different from the relaxed daily puzzle. Instant Nerdle is the hardest variant in many ways: you’re given all the digits and have exactly one guess to arrange them into the correct equation. There’s no forgiveness and no second chance. Pro Nerdle lets you create your own challenge and share it with a custom link, which makes it a great option for teachers, puzzle groups, or anyone who wants to challenge a friend with a specific calculation. If you enjoy number-based puzzles beyond equation guessing, the Numberle game on Numberble.com offers a similar challenge focused on pure number sequences, and it’s worth a look after you’ve built your Nerdle instincts. Strategy for Players Who Want to Improve The most important principle in Nerdle is information efficiency. Your first two guesses should collectively reveal as much as possible about which digits and operators are in play. Mathematically analyzed starting pairs like 12+35=47 and 80/16=05 together cover almost all the digits and both common operators across just two … Read more

How to Calculate Total Cost: Formula and Examples

how to calculate total cost

Knowing how to calculate total cost is one of the most practical skills in business, accounting, and everyday financial planning. Whether you are running a small manufacturing operation, evaluating a product line’s profitability, or studying economics, the total cost formula gives you a clear picture of what you are actually spending. This article walks you through the formula, explains what each component means before touching any math, and shows you a complete worked example with real numbers. By the end, you will know not just how to run the calculation, but what to do with the result once you have it. Quick Answer To calculate total cost, add your total fixed costs to your total variable costs: TC = TFC + TVC. Fixed costs stay the same regardless of output, while variable costs change with production volume. Divide total cost by units produced to find your average cost per unit. What Fixed and Variable Costs Actually Mean Before you can calculate total cost, you need to understand the two types of expenses that make it up, because confusing them is where most errors begin. Fixed costs are expenses that stay the same no matter how much or how little you produce. A bakery pays the same monthly rent whether it bakes 500 loaves or 5,000 loaves. Other classic examples of fixed costs include equipment lease payments, annual software subscriptions, and full-time salaried staff. These costs are predictable, which makes them the easier half of the calculation. Variable costs behave differently because they rise and fall directly with production volume. Raw materials are the clearest example: if you need $2 worth of ingredients to make one loaf of bread, making 1,000 loaves costs $2,000 in ingredients. Hourly labor, packaging materials, and utilities tied directly to machinery output also fall into this category. Understanding this distinction is not just a textbook formality. When you miscategorize a cost, your total cost figure will be wrong, and any pricing or production decision built on that number will be unreliable. The Total Cost Formula Explained The core formula for calculating total cost is straightforward: Total Cost (TC) = Total Fixed Costs (TFC) + Total Variable Costs (TVC). Each part of this formula answers a specific question. TFC answers “what do I spend just to keep the doors open?” and TVC answers “what do I spend because of how much I actually made?” Adding them together gives you the full picture of what production cost you during a given period. There is also a second version of the formula that works from averages rather than totals: TC = (Average Fixed Cost per Unit + Average Variable Cost per Unit) x Number of Units. According to AccountingTools, a well-established accounting reference, this per-unit approach is especially useful for evaluating specific product lines and spotting whether your cost structure needs adjusting. Both formulas lead to the same result, but the version you use depends on which numbers you have available at the time. A Step-by-Step Worked Example Imagine a small company called BrightPen Co. that manufactures ballpoint pens. Their monthly fixed costs total $8,000, covering factory rent ($5,000) and two salaried administrators ($3,000 combined). Their variable cost per pen is $0.50, covering ink, plastic casings, and hourly assembly labor. In a given month, BrightPen Co. produces 20,000 pens. Using the formula, the total variable cost is $0.50 x 20,000, which equals $10,000. Now add the fixed and variable costs together: $8,000 plus $10,000 gives a total cost of $18,000 for the month. That single number tells you what it cost to produce those 20,000 pens in full. To find the average cost per pen, divide $18,000 by 20,000 units, which comes to $0.90 per pen. This means BrightPen Co. must price each pen above $0.90 to cover its costs, and every cent above that figure contributes to profit. If the company is currently selling pens at $0.80 each, they are losing $0.10 per unit and need to either cut costs or raise their price. What the Result Tells You and What to Do With It The total cost figure on its own is not the destination. It is the starting point for three important decisions. First, it tells you your break-even point: divide your total fixed costs by the difference between your selling price per unit and your variable cost per unit to find out how many units you must sell before you start making money. Second, it informs your pricing strategy directly. If you set prices below average total cost, you lose money on every unit sold regardless of volume. Third, total cost comparison across months or production runs reveals cost efficiency trends. If your total cost rises faster than your output volume, your cost structure is deteriorating, which usually means variable costs are climbing unchecked. Using a loan calculator can also help when fixed costs include financed equipment, since the monthly repayment amount feeds directly into your TFC figure. Tracking total cost monthly and comparing it to revenue is one of the simplest ways to stay financially healthy as a business. What Most People Get Wrong About Total Cost Calculations The most common mistake is treating direct labor as a purely variable cost when it often behaves more like a fixed cost in practice. Many business owners calculate total variable cost by multiplying every worker’s hours by their wage, assuming headcount shrinks and grows perfectly in line with production. In reality, most operations keep a fixed core team regardless of output, meaning a significant portion of labor costs stay constant even when production dips. This is a genuine issue, not a minor technicality. When labor is misclassified as entirely variable, the total cost calculation understates fixed costs and overstates variable costs. The practical consequence is that the business appears more flexible than it actually is, which can lead to underpricing during slow periods and incorrect break-even projections. The correct approach is to split labor into its fixed component (salaried or guaranteed-hours employees) and its truly … Read more

How to Calculate Square Feet (Formula and Examples)

how to calculate square feet

This article shows you exactly how to calculate square feet for a room, a house, or an irregular plot of land, using nothing more than a tape measure and basic multiplication. You will see the standard formula applied to a real room with real numbers, and then learn how to handle shapes that are not perfect rectangles. Along the way you will pick up details that trip people up, like converting inches into decimal feet before multiplying, and handling closets, bump outs, or curved walls. By the end, you will be able to measure any space with confidence, whether you are ordering flooring, pricing a renovation, or simply curious how much room you actually have. Quick Answer To calculate square feet, measure the length and width in feet, and then multiply them together. A 10 by 12 foot room covers 120 square feet. For irregular shapes, split the area into smaller rectangles, calculate each one, and add the totals together. How to Calculate Square Feet for a Rectangular Room Picture a bedroom you are about to carpet, one that runs 13 feet from wall to wall and 11 feet across. Before any multiplication happens, it helps to know what those two numbers represent. Length is the longer side of the room measured wall to wall, and width is the shorter side measured the same way, both expressed in feet rather than inches or yards. Once both figures share the same unit, square footage is simply length multiplied by width, since you are filling the floor with imaginary one foot tiles and counting how many fit. For the bedroom above, 13 feet multiplied by 11 feet equals 143 square feet. That number alone does not mean much until you connect it to what you are actually doing with it. If you are buying carpet at eight dollars per square foot, 143 square feet translates into roughly 1,144 dollars before tax, padding, and installation. Compared to a typical primary bedroom in the United States, which usually falls between 140 and 200 square feet, this room sits at the smaller end of that range rather than being cramped or unusually large. Calculating Square Footage for L-Shaped and Irregular Spaces Most real rooms are not perfect rectangles, especially in older houses where a closet, bay window, or hallway nook breaks up the floor plan. The fix is straightforward and uses the same multiplication you just learned. You treat the irregular shape as two or more separate rectangles, work out the square footage of each piece on its own, and then add those smaller totals together to get the whole area. Say your living room is L-shaped, with a main section measuring 16 feet by 12 feet and a smaller extension measuring 6 feet by 8 feet. The main section comes to 192 square feet, the extension adds 48 square feet, and the total living room area is 240 square feet once you combine them. Circles, Triangles, and Other Common Shapes Not every space you measure is a rectangle, especially a round patio, a triangular flower bed, or a curved driveway. For a circle, measure the diameter, divide it by two to get the radius, multiply the radius by itself, then multiply that result by 3.14. A patio with a 14 foot diameter has a radius of 7 feet, and 7 times 7 times 3.14 works out to roughly 153.9 square feet. Triangles work differently. Multiply the base by the height, and then divide by two, so a triangular yard with a 20 foot base and a 15 foot height covers 150 square feet. The National Institute of Standards and Technology maintains an official page on calculating area that covers these shapes with diagrams. This kind of measurement is also the first input for ordering materials, since concrete is priced and delivered by volume rather than flat area alone. Numberble’s concrete calculator can turn that figure into the cubic yards you need for a slab of a given thickness, saving you from guessing at delivery quantities. Getting this wrong matter, since too little concrete mid pour creates a weak seam, while too much wastes money on material that gets dumped. Converting Square Feet to Square Yards, Meters, and Marla Square footage does not always arrive in the unit you need, especially when a project involves ordering carpet by the yard or comparing listings from a metric country. Converting to square yards is simple, since there are exactly 9 square feet in a square yard, so you divide your total by 9. The 240 square foot living room from the earlier L-shaped example equals about 26.7 square yards once you do that division. Converting to square meters uses a different factor, since each square foot equals 0.0929 square meters, so that same room comes out to roughly 22.3 square meters. If you are dealing with property in Pakistan, India, or elsewhere in South Asia, square feet alone often will not match how local listings describe a plot, since marla, kanal, and gaj remain the everyday units in property transactions across the region. One marla equals 225 square feet, one kanal equals 20 marla or 4,500 square feet, and one gaj is roughly one square yard at 9 square feet. A plot listed as 5 marla, a common size in Pakistani housing societies, works out to 1,125 square feet, useful when comparing it against a Western style floor plan. Knowing these conversions before you visit a site or sign paperwork can prevent a real misunderstanding about how much space you are buying. Why Getting Your Square Footage Right Actually Matters An accurate square footage figure affects far more than a single purchase, since it feeds into budgets, comparisons, and decisions that are hard to undo once material has been cut or a contract has been signed. Underestimating a room’s size by even a few feet can mean running short on flooring mid installation, forcing a second trip to the store for a dye lot that does … Read more

How to Calculate Percent Difference Between Two Values

how to calculate percent difference

Knowing how to calculate percent difference is one of those practical math skills that come up constantly, from comparing prices at two stores to analyzing test scores or scientific measurements. This article covers the exact formula, walks through a real numeric example step by step, and explains what your result actually means once you have it. You will also learn the one mistake that trips up almost everyone the first time they do this calculation, and how to avoid it completely. Quick Answer To find percent difference, subtract one value from the other and take the absolute value of that result. Then divide it by the average of the two values. Multiply by 100 to express it as a percentage. The formula is: |V1 − V2| ÷ ((V1 + V2) ÷ 2) × 100. The Percent Difference Formula Explained in Plain English Picture this: a shop in your area sells a laptop for $840, and an online store sells the same model for $960. You want to know how different those two prices are, not which one is cheaper, but how far apart they are relative to each other. That is exactly the situation percent difference was built for. The formula looks like this: Percent Difference = |V1 − V2| ÷ ((V1 + V2) ÷ 2) × 100. Each part of that formula has a specific job. The |V1 − V2| section finds the gap between the two numbers, and the absolute value bars mean you always treat that gap as positive, regardless of which number is larger. The denominator ((V1 + V2) ÷ 2) finds the average of your two values, which acts as your neutral reference point. Dividing the gap by the average gives you a ratio, and multiplying by 100 converts that ratio into a percentage you can actually use. The reason you use the average rather than one specific value as the reference is that neither number is more “original” or “base” than the other. You are not tracking change from one point to another; you are measuring how different two equal-standing values are from each other. That distinction matters a great deal, and it is the source of the most common confusion around this topic, which we will get to shortly. Step-by-Step Calculation with Real Numbers Back to those two laptop prices: $840 and $960. Here is the full calculation carried out one step at a time. Step 1: Find the absolute difference. Subtract the smaller from the larger: 960 − 840 = 120. Since you always want a positive value here, the absolute difference is 120. Step 2: Find the average of the two values. Add them together and divide by 2: (840 + 960) ÷ 2 = 1800 ÷ 2 = 900. Step 3: Divide the difference by the average. 120 ÷ 900 = 0.1333. Step 4: Multiply by 100. 0.1333 × 100 = 13.33%. The percent difference between those two laptop prices is 13.33%. That number tells you the two prices are about 13% apart relative to their combined midpoint. Whether that is significant depends on context: in everyday shopping, 13% is a meaningful gap and probably worth acting on. In a scientific experiment comparing two sensor readings, 13% could indicate a serious calibration issue. The number alone does not make the judgment call; that is your job once you have the result in hand. When to Use Percent Difference vs. Percent Change These two calculations are regularly used interchangeably, and doing so leads to the wrong answer every time. Percent difference is the right tool when neither of your two values is a baseline, a starting point, or a reference. Comparing the salaries of two colleagues, the prices at two competing stores, or the scores of two students on the same test: all of these are percent difference situations because both values hold equal status. Percent change, on the other hand, applies when one value is the original and the other is the updated or new version. A product that cost $50 last year and costs $65 this year is a percent change situation, because the $50 is clearly the starting point. The percent change formula uses only the original value in the denominator, not the average of both. If you want to calculate that kind of comparison, the Percentage Calculator on Numberble handles both percent change and percent difference, so you can choose the right calculation for your specific situation without doing the arithmetic manually. What Most People Get Wrong About Percent Difference The most widespread mistake is using just one of the two values in the denominator instead of the average of both. Someone comparing 80 and 100 will often divide the difference (20) by 80, getting 25%, or divide by 100, getting 20%. Neither of those is the percent difference. The actual percent difference is 20 ÷ 90 × 100 = 22.22%, because 90 is the average of 80 and 100. This error happens because people mentally reach for percent change logic when they should be using percent difference logic. If you already decided which of your two values is the “original,” you are already calculating percent change, not percent difference. The moment you treat both values symmetrically, using their average as the denominator, you are doing the calculation correctly. A quick way to check you: swap V1 and V2 in the formula. If your answer changes, you are not calculating percent difference, you are calculating something else. Practical Examples across Different Fields Science and lab work: A researcher measures a compound’s concentration at 4.2 mg/L in one sample and 5.6 mg/L in another. Absolute difference: 1.4. Average: (4.2 + 5.6) ÷ 2 = 4.9. Percent difference: 1.4 ÷ 4.9 × 100 = 28.57%. That result would prompt most researchers to investigate whether the variation is within acceptable margins or signals contamination. Business and pricing: Two suppliers quote $3,200 and $2,750 for the same bulk order. Absolute difference: 450. Average: (3200 + 2750) ÷ 2 = 2975. … Read more

How to Calculate Food Cost (Formula + Examples)

how to calculate food cost

Knowing how to calculate food cost is one of the most practical skills any restaurant owner, chef, or food entrepreneur can have. This article walks you through the two main formulas, explains what every part of each formula actually means, and shows you the math with real numbers from a real scenario. You will also learn what a healthy food cost percentage looks like, where most people go wrong, and how to use the results to make smarter decisions about your menu and your margins. Quick Answer To calculate food cost percentage, use: (Beginning Inventory + Purchases − Ending Inventory) ÷ Total Food Sales × 100. For a single dish, divide the total ingredient cost by the menu selling price and multiply by 100. Most healthy restaurants keep this figure between 28% and 35%. The Two Formulas You Actually Need Most food businesses need to track food cost in two different ways: across the whole operation for a given period, and per individual dish. Both matter and neither replaces the other. Start with the period-based formula because it tells you whether your entire kitchen is running efficiently. The overall food cost formula works like this: take the value of the food you had at the start of the week (beginning inventory), add everything you purchased during that week, then subtract whatever food is still sitting in your kitchen at the end of the week (ending inventory). The number you are left with is your Cost of Goods Sold, or COGS. Dividing COGS by your total food sales for that same week, then multiplying by 100, gives you your food cost percentage. Here is how that looks with real numbers. Suppose your beginning inventory is worth $4,200, you purchase an additional $9,800 worth of food during the week, and your ending inventory comes to $7,000. Your COGS is $4,200 + $9,800 − $7,000, which equals $7,000. If your total food sales for that week were $23,000, your food cost percentage is $7,000 ÷ $23,000 × 100, which comes out to 30.4%. For most full-service restaurants, that number sits comfortably within the healthy range. How to Calculate Food Cost Per Dish The dish-level formula is what you use when pricing a new menu item or checking whether an existing one is still contributing to your margins. Every ingredient in the dish gets priced at its per-serving cost, those costs are added together, and that total is divided by the menu price and multiplied by 100. The resulting percentage tells you how much of the selling price is consumed by raw ingredients alone. Say you are pricing a grilled salmon dish. The salmon portion costs $5.20, the vegetables $0.85, the sauce $0.45, and the garnish $0.20. Your total ingredient cost per plate is $6.70. If you plan to sell it for $24.00, your food cost percentage for that item is $6.70 ÷ $24.00 × 100, which gives you 27.9%. That is solid. A dish sitting below 30% leaves room to cover labor, overhead, and still make a profit. You can use a percentage calculator to run these division-and-multiplication steps quickly, especially when you are pricing several dishes at once and want to cross-check your math without errors. What a Healthy Food Cost Percentage Actually Looks Like Knowing your food cost number only becomes useful when you know what range to compare it against. According to industry data from US Foods, food cost percentage sits at around 28–32% on average for full-service and limited-service restaurants, with most profitable operations landing somewhere in that window. Fine dining establishments sometimes run slightly higher because of premium ingredients, while fast-casual and counter-service operations often aim for the lower end of the range. A figure above 38% is a warning sign, and it typically points to one or more identifiable problems: poor portion control, supplier pricing that has crept up without menu price adjustments, spoilage, or untracked waste. A figure below 25% sounds appealing, but it can indicate under-portioning that frustrates customers, or heavy reliance on beverage sales that skew the overall numbers. The goal is not just to be “low” but to be accurate and consistent, and to understand exactly why your percentage sits where it does. You can find more context on how industry professionals use these benchmarks to manage their operations. What Most People Get Wrong About Food Cost One of the most persistent mistakes in food costing is confusing theoretical food cost with actual food cost, and assuming the two should always match. Theoretical food cost is what your numbers would look like in a perfect world: every ingredient weighed exactly, zero spoilage, no over-portioning, no theft. Actual food cost is what really happened once your kitchen ran through a full week of service. Many operators spend time trying to get their actual food cost down to match their theoretical figure and feel like something is broken when there is always a gap. The correct understanding is that some gap will always exist, and the goal is to keep it narrow and to understand what is driving it. A 2–3% variance between theoretical and actual is manageable. A 7–10% gap demands investigation. Chasing the theoretical number as if it should equal the actual one leads to frustration, while tracking the variance consistently leads to real improvements. Common Mistakes That Inflate Your Food Cost One of the most common errors is using different time periods for different parts of the formula. If your beginning inventory is from Monday morning but your food sales figure comes from a POS report that starts Sunday, your percentage will be wrong every time. Every number in the formula must come from the same period, whether that is a week, a biweekly cycle, or a calendar month. Getting this detail right sounds obvious, but it is the single most frequent source of inaccurate food cost tracking in busy kitchens. Another widespread mistake is leaving certain ingredients out of the dish cost calculation. Cooking oil, salt, garnishes squeeze bottle sauces, … Read more

How to Calculate Effective Tax Rate (With Examples)

how to calculate effective tax rate

Your tax bracket and your actual tax burden are two completely different numbers, and most people never realize this until they do the math themselves. This article walks you through exactly how to calculate effective tax rate, what the formula means in plain terms, and what that final percentage actually tells you about your finances. You will also learn why your effective rate is almost always lower than your bracket, how to avoid the most common calculation mistake, and how this number can guide smarter decisions around retirement contributions, deductions, and year-end planning. By the end, the math will make complete sense and you will know what to do with the answer. Quick Answer Divide your total federal income tax paid by your total gross income, then multiply by 100. For example, if you paid $8,500 in federal taxes on $65,000 of income, your effective tax rate is 13.1%. This rate reflects what you actually paid on average across every dollar you earned, not just the last one. The Formula and What Each Part Actually Means Start with a real scenario. Sarah is a single filer who earned $72,000 in 2025. After taking the standard deduction of $15,750, her taxable income came down to $56,250. Applying the 2025 federal tax brackets, she owed $1,193 on the first $11,925 at 10%, then $4,386 on the next $36,550 at 12%, then $1,788 on the remaining $7,775 at 22%. That brings her total federal tax liability to $7,367. The formula itself is straightforward: effective tax rate equals total taxes paid divided by gross income, multiplied by 100. The “total taxes paid” figure is the actual dollar amount owed to the IRS after applying all brackets, not the rate of the highest bracket you fall into. The “gross income” figure is your total income before any deductions are subtracted, which is the number that captures the full picture of what you actually earned. Applying this to Sarah’s numbers: $7,367 divided by $72,000 gives 0.1023, and multiplying by 100 produces an effective tax rate of approximately 10.2%. Even though her income pushed her into the 22% bracket, she paid the equivalent of just over 10 cents on every dollar she earned. That is the power of the progressive tax system working in her favor, where only the portion of income above each bracket threshold gets taxed at the higher rate. Walking Through the Full Calculation Step by Step Step one is finding your gross income, which means adding up every source of taxable earnings for the year including wages, freelance income, rental income, dividends, and capital gains. Step two is applying the standard deduction (or your itemized deduction total if it exceeds the standard amount) to arrive at taxable income. Step three is applying each tax bracket progressively to that taxable income, calculating the tax owed in each tier before adding them together to get your total liability. Once you have your total tax liability from your Form 1040 (it appears on line 24), the calculation becomes simple division. Divide that number by your gross income and multiply by 100 to express it as a percentage. If you filed your return but did not note your gross income separately, you can find your adjusted gross income on line 11 of Form 1040 and use that as a reasonable stand-in. For a quick check on percentages without doing all the division manually, a percentage calculator handles this in seconds once you have both numbers in front of you. Some sources and analysts divide total taxes by taxable income (after deductions) rather than gross income. That version will always produce a higher effective rate number than dividing by gross income. Neither approach is wrong, but you should stay consistent and know which denominator you are using so your comparisons across years actually mean something. What Your Effective Tax Rate Tells You in Real Life A lower effective rate is generally good, but context matters enormously. If Sarah’s rate came out to 10.2%, that tells her that for every $100 she earned, she kept about $89.80 after federal taxes. It does not include state income taxes, payroll taxes like Social Security and Medicare, or any local taxes, so her real overall tax burden is higher than that single number suggests. Understanding this distinction prevents a false sense of security when planning a budget. Where the effective rate becomes most useful is in year-over-year comparison and planning decisions. If your effective rate jumps significantly from one year to the next despite similar income, it often signals that you lost a deduction, received a lump sum like a bonus or retirement distribution, or that a change in filing status affected your brackets. Tracking it annually gives you an early warning system for tax planning rather than a surprise at filing time. For individuals weighing whether to increase 401(k) contributions, this rate shows the immediate federal tax savings you would capture by reducing taxable income before it gets taxed. Businesses calculate this figure slightly differently, dividing total income tax paid by pre-tax earnings. The concept is the same but corporate tax planning uses effective rate to measure whether available deductions and credits are being fully utilized across a fiscal year. The IRS provides detailed guidance on both individual and corporate income tax calculations through its official resources at irs.gov, which is worth bookmarking if you plan to review actual bracket thresholds each filing season. What Most People Get Wrong About Effective Tax Rate The most widespread mistake is treating the effective tax rate as though it already accounts for every tax a person pays. Someone sees their effective federal income tax rate of 12% and assumes that is their total tax burden for the year. That assumption ignores payroll taxes, which take an additional 7.65% from most employees’ wages before they even see their paychecks, plus whatever state income tax applies in their location. In some states, a middle-income earner might face an additional 5% to 9% state income tax … Read more

How Many Days Is 2 Weeks? (Quick Answer)

how many days is 2 weeks

Two weeks is one of the most commonly referenced time spans in everyday life, and this article gives you the exact answer along with practical context that makes the number genuinely useful. Whether you are counting down to a deadline, waiting on a prescription, planning a notice period at work, or just trying to calculate a future date, knowing how many days is 2 weeks puts you in control of your schedule. The answer itself is simple, but understanding what that number looks like in hours, minutes, and real situations makes it far more actionable. By the end of this article, you will know exactly how to work with a two-week timeframe in any practical context. Quick Answer Two weeks equals exactly 14 days. This is because one week always contains 7 days, and multiplying that by 2 gives you 14. Whether you count calendar days, business days, or weekends, a two-week period spans 14 total days from start to finish. How Many Days Is 2 Weeks, Exactly? Two weeks is exactly 14 days. A week contains 7 days by universal definition, so two of them always add up to 14, no exceptions, no variation by month or season. The calculation is as clean as math gets: 2 multiplied by 7 equals 14. This might seem too obvious to explain, but the confusion often comes from how people use the phrase “two weeks” in real life. When someone says “I’ll have it done in two weeks,” they typically mean 14 calendar days from the current date, not 14 business days, not the end of the second calendar week. Knowing the precise count matters when timelines carry real consequences, like lease agreements, medical recovery periods, or project deadlines. If you also want to think about it in other units, 14 days works out to 336 hours, 20,160 minutes, or 1,209,600 seconds. Those larger numbers can feel abstract, but they are useful when you are managing tight schedules or calculating overtime. The two-week figure is also equivalent to roughly 0.46 months, which is why two weeks and half a month are often used interchangeably even though they are slightly different depending on the month. Breaking Down a Two-Week Period in Real Life Imagine your employer gives you a two-week notice requirement before you can resign. You hand in your notice on a Monday. That means your last day is the Monday exactly 14 days later, which lands on the second Monday after you submitted your letter. Counting it out, you work through the rest of week one (days 1 through 7) and all of week two (days 8 through 14), finishing on day 14. This kind of practical counting is where people most often trip up. They assume “two weeks” means two full Monday-to-Sunday cycles on the calendar, but the clock actually starts from whatever day you begin. Day one is the first day of your two-week period, not the following Monday. If you start on a Wednesday, your 14-day count ends on the Tuesday two weeks later, not on a Sunday. You can use the Age Calculator at Numberble to quickly find the exact date 14 days from any starting point, which saves you from manually counting squares on a calendar. It handles the day-of-week arithmetic automatically and shows you the precise end date in seconds. Two Weeks in Different Contexts The meaning of “two weeks” shifts depending on the field you are working in. In medicine, a two-week window is a standard observation period for many treatments, vaccines, and medication trials. Doctors use 14 days as a baseline because it is long enough to observe physiological responses while remaining short enough to adjust a course of treatment without significant delay. In employment law, two weeks is the standard minimum notice period across many countries and companies. Fourteen days gives both the employer and the employee enough time to transition responsibilities, wrap up ongoing work, and begin the handover process. For international travelers, a two-week trip (14 nights) often qualifies as the benchmark for “long-stay” travel discounts on flights and accommodation packages. In project management, a two-week sprint is the default cycle in Agile methodology. Teams plan 14 days of work in advance, execute against that plan, and then review and reset. The reason it works is that 14 days is short enough to stay focused and long enough to complete meaningful work, making it one of the most widely adopted time blocks in modern software development. What Most People Get Wrong About Two Weeks The most common mistake is treating “two weeks” and “14 business days” as the same thing. They are not, and confusing them can cause real problems with deadlines. Business days exclude weekends and public holidays, so 14 business days actually spans closer to 18 to 20 calendar days depending on when those holidays fall. This confusion happens because people hear “two weeks” in a professional context and unconsciously filter out the weekends, assuming the other person is talking about working time. A contractor who promises to finish a job in “two weeks” almost certainly means 14 calendar days. A government agency that says a response will take “14 business days,” however, is telling you to expect a reply in roughly three calendar weeks. Always clarify which kind of days are meant when a timeline carries any financial or legal weight. According to Time and Date, the concept of a 7-day week has roots going back thousands of years and is now standardized globally, which is why two weeks reliably means 14 days in every country and every calendar system in widespread use today. How to Count 14 Days Accurately Counting 14 days from a given date sounds simple, but most people make a small error: they count the starting day as day one. Whether you count the starting date or the day after it as day one changes your end date by exactly one day. The correct approach depends on context. For most legal and … Read more